Docket Article
Thesis-Driven Origination: From Thesis to Target List
How to turn a private equity investment thesis into a target list: testable criteria, data sources, a NAICS universe, sampling and an exclusion log.
Summary
- 01Turn each thesis claim into a hard disqualifier, a scored criterion or a research question. Define an observable and evidence standard so researchers can reach the same answer.
- 02Map each criterion to a source before searching. Record whether the source describes an establishment, legal entity or brand, and what a negative search result means.
- 03Define the universe with seed-company classifications, code vintage, geography and an observable size proxy. SUSB sizes aggregate cells; the company list comes from other sources.
- 04Calibrate on a random sample from the whole universe, using an independent reviewer and the screen on the same companies. Examine both false passes and false exclusions.
- 05Record exclusion reasons, criterion versions and evidence so changes can be applied to affected records. Keep unresolved identities and unknown criteria pending.
- 06Assess add-on segments against the core on customers, costs, channels, capabilities and competition. Keep mixed-overlap adjacencies in separate universe records.
Inside this article
From thesis statement to testable claims
An investment thesis usually arrives as a sentence: "fragmented recurring-service businesses in the Southeast, where a platform can professionalize the back office and add route density." That sentence is a reason to look, not a list. Thesis-driven origination turns it into claims a researcher can check company by company, with a record of which companies passed, failed or stayed unresolved.
First, decompose: pull out every claim the thesis makes about a company that would belong on the list. Each becomes one of three things:
- A hard disqualifier: a condition that removes the company regardless of anything else (wrong activity, already sponsor-owned, outside the geography).
- A scored criterion: a condition that ranks companies that survive the disqualifiers (share of recurring work, number of locations, owner tenure).
- A research question: something the thesis depends on but that public evidence cannot settle at the screening stage (margin profile, contract terms, willingness to sell). These stay open and go to the first conversation, not into the filter.
The test of a well-written claim is whether two researchers given the same company and the same sources would reach the same answer. "Strong recurring revenue" fails that test. "Publishes a scheduled maintenance or inspection plan on its own website, retained and dated" passes it, because it names the observable, the source and the evidence standard. It also implies what it does not prove: a published plan is not contracted revenue.
| Thesis fragment | Claim | Type | Observable | Value when unknown |
|---|---|---|---|---|
| "recurring-service businesses" | Company performs a service on a repeat schedule | Scored | Service-plan or inspection-cycle language on the company's own site | Pending, not excluded |
| "fragmented" | No single operator dominates the defined market | Universe-level, not company-level | Count and size distribution of candidates in the defined universe | Thesis-level open question |
| "in the Southeast" | Operates from a location in the named states | Hard disqualifier | Registered office or operating address | Pending until resolved |
| "platform can professionalize the back office" | Target is founder-run and lightly systemized | Research question | Not reliably observable from public data | Carried to first call |
| "add route density" | Service area overlaps or adjoins a platform's | Scored (add-on lists only) | Service-area pages, location addresses | Pending |
Some thesis claims are about the market, not any single company; they belong to universe definition, not the screen. Others cannot be screened at all; writing them down as research questions keeps them from becoming proxies that look precise and are not. Docket's thesis notes are written in this form: each states a mechanism, the evidence to seek, the reasons to stop and the questions for the target list.
Criteria design itself (weights, anchors, missing data) is covered in building consistent acquisition screening criteria; this article covers what goes into the criteria and how the list is built and documented.
Why specialization shapes origination
The most-cited evidence on how sponsors organize comes from Gompers, Kaplan and Mukharlyamov's survey of 79 private equity investors. In the 2015 NBER working-paper version, the authors report that only 37% of respondents are organized as generalists and that "more than 50% of the firms are organized by industry" [1]. They suggest three advantages: specialists are more likely to find an opportunity in their industry, to evaluate it when it appears, and to understand whether and how value can be added [1]. The paper was later published in the Journal of Financial Economics (2016); the figures here are from the openly available working paper, because the published version is closed access.
The same survey describes the funnel a thesis feeds. For every hundred opportunities considered, the average respondent deeply investigates fewer than 24, signs an agreement with fewer than 14 and closes on 6 [1]. Respondents described almost 36% of closed deals as "proactively self-generated" and about 33% as investment-bank generated, and considered almost 48% of closed deals proprietary in some way; the authors state they have no way to validate what "proprietary" means or how far the deals truly were [1]. These are 2015 self-reports: useful for shape, not a benchmark.
If roughly six in a hundred considered opportunities close, the thesis decides which hundred get considered. A vague thesis fills the funnel with companies that fail on facts knowable at the start.
There is a peer-reviewed literature on whether specialization confers an advantage in private equity, for example Cressy, Munari and Malipiero's study in the Journal of Corporate Finance (2007). We cite it here to point to that literature, not for a specific finding: no abstract or open full text was available to review for this article.
Mapping each criterion to a data source
Each claim needs a source that can actually answer it, not merely one that is available. Build the map before searching.
| Criterion type | Typical public source | What it can support | What it cannot support |
|---|---|---|---|
| Industry / activity | Census industry statistics (SUSB, by NAICS); the company's own site | Universe boundaries; whether the company describes the activity | That the activity is the company's main revenue line |
| Employer size band | Census SUSB (aggregate only) | How many employer establishments sit in an industry, geography and enterprise-size cell | Any individual company's size |
| Legal identity and status | State business registries | That a legal entity exists, its status and filing history | Revenue, ownership percentages in most states |
| Government customer exposure | SAM.gov registrations, USAspending awards | Registration and federal award history for a resolved entity | Commercial revenue or total revenue |
| Licensed activity | State licensing boards | That a licence exists for a named holder, scope and expiry | That the licence holder is the operating company you mean, without a crosswalk |
| Growth signals | Job postings, location openings | That the company advertised roles or opened sites | Hires, headcount or revenue growth |
| Ownership | Registries, press releases, sponsor portfolio pages | Positive evidence of sponsor or corporate ownership | Absence of a sponsor (no evidence is not evidence of independence) |
Two rules make the table usable. First, record for each criterion the entity level the source speaks to: establishment, legal entity or brand. SUSB counts establishments with paid employees [2]; a registry counts legal entities; a website speaks for a brand. Joining them without an identity step produces duplicates and false matches. Second, record what a negative result means. "Not found in the licensing database" is a research status, not a disqualifier, until the search is shown to cover the right name and jurisdiction.
The test of a well-written claim is whether two researchers given the same company and the same sources would reach the same answer.
Defining the universe with NAICS
The universe is the set of companies the thesis applies to before company-level screening; defining it makes "we reviewed the market" checkable.
NAICS is the standard federal statistical agencies use to classify business establishments; it is production-oriented, grouping establishments by similarity of production process, and hierarchical, from 2-digit sectors through 3-digit subsectors, 4-digit industry groups and 5-digit industries to 6-digit national industries [3]. The 2022 Economic Census is published on the 2022 NAICS vintage [3], so record the vintage alongside every code list.
The Census Bureau's Statistics of U.S. Businesses (SUSB) is the usual sizing layer. It is an annual series covering U.S. establishments with paid employees, reporting firms, establishments, employment and annual payroll by establishment industry and enterprise size, at U.S., state, metropolitan area, county and congressional-district level; the latest data year shown on the program page is 2022 [2]. Three consequences for a thesis universe:
- It excludes non-employers. A thesis aimed at owner-operators with no payroll is not described by SUSB.
- It lags. A 2022 data year sized in late 2026 describes the market four years ago.
- It is aggregate. SUSB tells you how deep a cell is, not which companies are in it. The company list comes from other sources.
A workable sequence:
- Start from five to ten seed companies that clearly fit the thesis.
- Find how each is classified, and take the union of codes rather than picking the one that sounds right.
- Set geography as a list of states, metro areas or counties, matching the SUSB geography you will size against.
- Set a size band as a proxy you can observe (employment band, location count), not as revenue.
- Write the universe definition as one record: code list with vintage, geography, size band, date.
NAICS codes bound the search; they rarely match a colloquial niche, and self-reported codes drift. Failure modes and mitigations are covered in mapping a fragmented industry from public data.
- 01Start with seed companies
Choose five to ten companies that clearly fit the thesis.
- 02Combine their classifications
Find each seed company's classification and take the union of codes.
- 03Specify the geography
List states, metro areas or counties that match the SUSB geography used for sizing.
- 04Choose an observable size proxy
Use an observable employment band or location count as the size proxy.
- 05Write the universe record
Record the code list with vintage, geography, size band and date together.
Sampling and calibration
- 01Sample the universe
Draw a random sample from the universe so the review can expose companies the screen wrongly removes.
- 02Review without the screen result
Have a senior reviewer judge each sampled company against the thesis by hand, without seeing the screen result.
- 03Screen and cross-tabulate
Run the screen on the same sample and cross-tabulate its results against the reviewer's judgments.
Before running the full screen, calibrate on a sample.
- Draw a random sample from the universe, not from the companies the screen passes. If you sample only passes, you measure precision but never see what the screen wrongly removed.
- Have a senior reviewer judge each sampled company against the thesis by hand, without seeing the screen's result.
- Run the screen on the same sample and cross-tabulate.
| Reviewer: fits thesis | Reviewer: does not fit | |
|---|---|---|
| Screen: pass | True pass (A) | False pass (B) |
| Screen: exclude | False exclusion (C) | True exclusion (D) |
Two ratios matter:
- Precision of passes = A ÷ (A + B). Low precision fills the outreach list with companies the deal team will reject.
- Miss rate among fits = C ÷ (A + C). A high miss rate means the screen is removing the companies the thesis is about, usually because a disqualifier keys on an observable that fits miss (a website phrase, a code, a licence type).
Illustrative, fictional numbers: a team samples 60 records from its universe. The reviewer judges 18 to fit. The screen passes 22, of which 14 are reviewer fits; it excludes 4 fits. Precision is 14 ÷ 22 = 64%; miss rate is 4 ÷ 18 = 22%. Reading the four misses shows all were excluded by a "publishes service plans" criterion because they describe recurring work in other words. The team changes that criterion from a disqualifier to a scored item and re-runs the sample.
Sample sizes for a pass/fail acceptance test of a research batch are a separate question, with exact zero-defect tables in the target audit sampling worksheet. For calibration the aim is narrower: find which criterion is doing the damage, change it once, and record the version.
Logging exclusions
Every company removed from the universe should carry a reason code, the criterion version that removed it and the evidence. When the thesis changes, a list without reasons must be re-screened from scratch; a list with reasons can be re-run on the affected codes only.
| Code | Meaning | Evidence required | Reversible when |
|---|---|---|---|
ACT | Activity outside the thesis | Retained page showing the actual activity | Thesis boundary widens |
GEO | Outside defined geography | Address evidence for operating locations | Geography changes |
SIZE | Outside the size band on the stated proxy | Proxy value, source and date | Band or proxy changes |
OWN | Already sponsor- or corporate-owned | Positive ownership evidence | Ownership changes |
DUP | Duplicate of another record | ID of the surviving record | Never; merge instead |
ID | Identity unresolved | What was tried | Identity resolved |
UNK | Criterion unknown | The open question | Evidence found |
Keep ID and UNK out of the excluded pile; they are pending states. A screen that counts unknowns as failures is biased against companies with the thinnest public footprint, often the ones a proactive approach is looking for.
Minimum fields per exclusion row: record ID, legal name as resolved, reason code, criterion and version, evidence URL, date retrieved, reviewer, and a free-text note limited to what the evidence shows.
- Log a reason code, criterion version and evidence for every company removed.
- When the thesis changes, re-run records with the affected reason codes.
- Keep unresolved identities and unknown criteria pending, using ID and UNK.
- Treat a missing licensing result as a research status until the search covers the right name and jurisdiction.
Adjacency and add-on logic
A buy-and-build thesis needs a boundary rule for what counts as "the same business". Bain defines buy-and-build as an explicit strategy of using a well-positioned platform to make at least four sequential add-on acquisitions of smaller companies, and frames add-on diligence around one question: how much overlap there is between the two companies' customers, costs, channels, capabilities and competition [4]. In the same piece, a roll-up assumes significant, if not total, overlap; close-in adjacencies have less, and two-step adjacencies have significant differences [4].
That lens converts into a boundary worksheet. Rate each candidate segment against the core on the five dimensions:
| Dimension | Question to answer from evidence | Rating |
|---|---|---|
| Customers | Same buyer type and purchase decision? | High / partial / low |
| Costs | Same labour pool, equipment and cost structure? | High / partial / low |
| Channels | Reached through the same sales route? | High / partial / low |
| Capabilities | Same licences, skills, certifications? | High / partial / low |
| Competition | Do the same competitors show up? | High / partial / low |
Segments rated high on most dimensions belong in the core universe. Segments with mixed ratings are adjacencies: list them separately, with their own universe record. Bain also notes that successful buy-and-build strategies target fragmented industries with sufficient acquisition targets of the right size [4], which makes universe depth in the right size band a thesis-level test to run before company-level work.
Worksheet: thesis-to-list template
The example below is entirely fictional and shows the shape of the record, not a market fact.
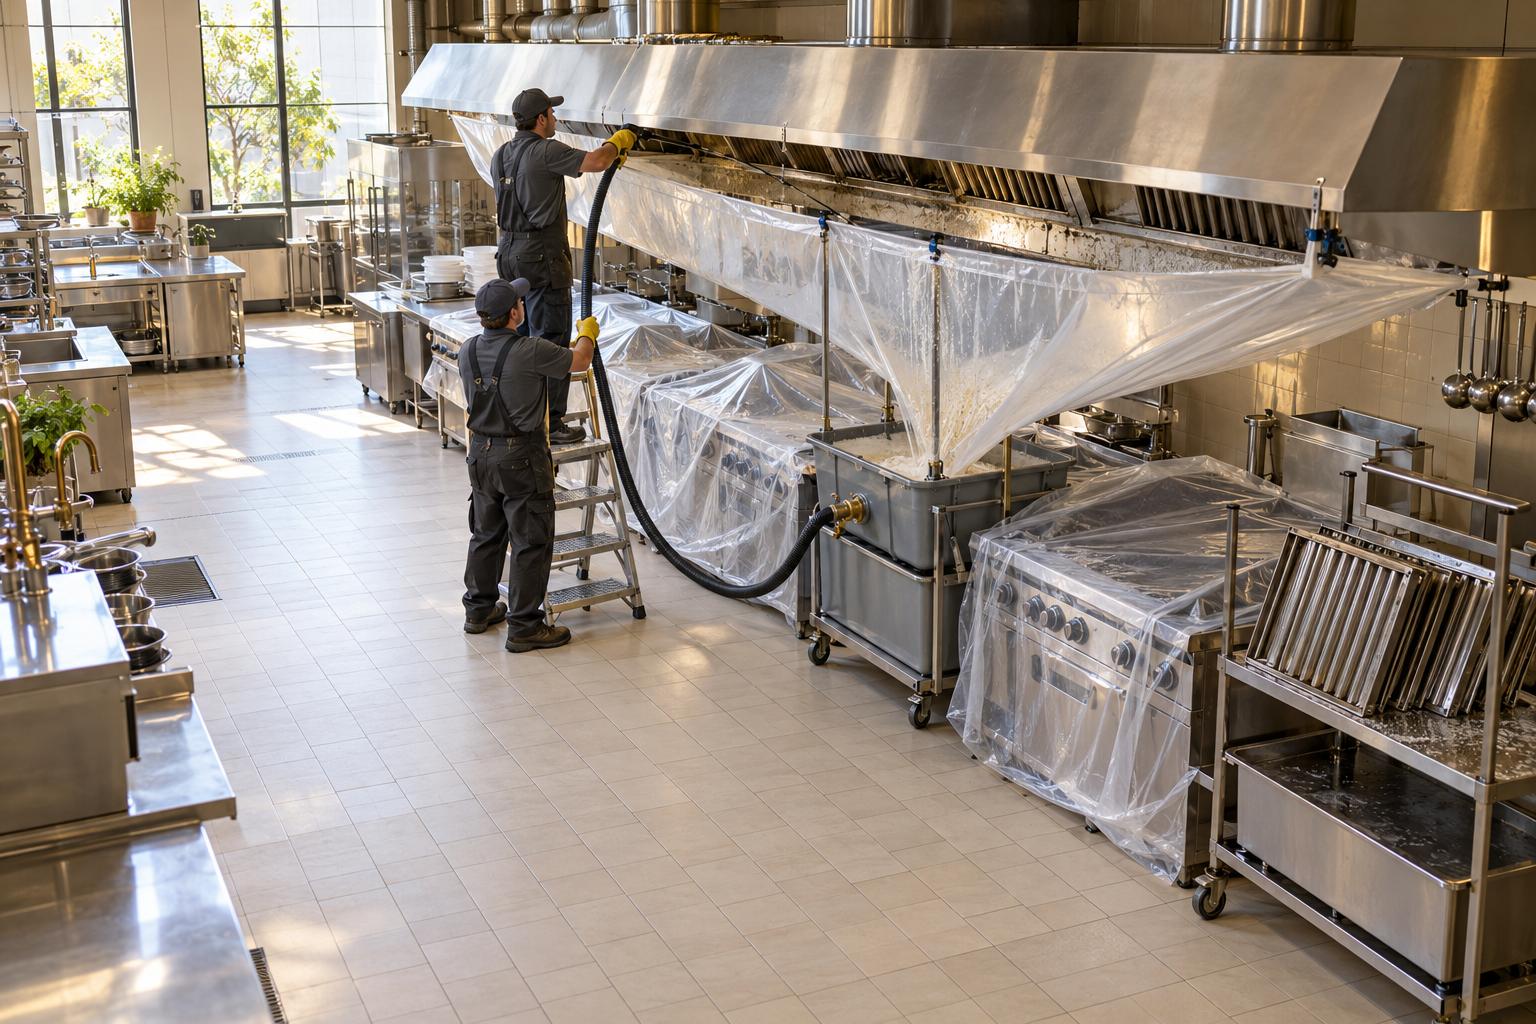
Thesis (illustrative): Recurring commercial inspection-and-cleaning services for restaurant kitchen ventilation in three neighbouring states, where a platform could consolidate scheduling and compliance paperwork.
| Field | Entry (illustrative) |
|---|---|
| Thesis version | v1.0, dated |
| Mechanism | Shared scheduling and compliance reporting across route-based crews |
| Hard disqualifiers | Activity is not inspection/cleaning; no operating location in the three states; sponsor- or corporate-owned with positive evidence |
| Scored criteria | Evidence of scheduled service cycles; number of operating locations; years operating under current legal entity |
| Research questions (first call) | Share of revenue under recurring arrangements; owner's role in sales; customer concentration |
| Universe codes | Union of codes from 8 seed companies, vintage recorded |
| Geography | Three named states |
| Size proxy | 2 to 6 operating locations or 10 to 75 employees, whichever is observable |
| Sources per criterion | Company site (activity, cycles), state registry (identity, status), licensing boards where applicable (capability), ownership searches |
| Overlap rating of adjacent segment "grease-trap services" | Customers high, costs partial, channels high, capabilities low, competition partial: listed as an adjacency, not core |
Fictional funnel, labelled as such:
| Step | Records (fictional) | Note |
|---|---|---|
| Raw candidates from all sources | 1,140 | Before identity resolution |
| After de-duplication and identity resolution | 870 | 270 DUP; 41 left as ID (pending) |
| After hard disqualifiers | 312 | Each exclusion coded and evidenced |
| Calibration sample changed one criterion | 338 | 26 restored from ACT after criterion v1.1 |
| Scored, top tier | 95 | Goes to the outreach approval step |
Pending (ID + UNK) | 41 + 63 | Owned research questions, not exclusions |
Checklist before the list leaves research:
- Thesis decomposed into disqualifiers, scored criteria and research questions, each with an observable.
- Each criterion mapped to a source, with the entity level and the meaning of a negative result.
- Universe record written: codes with vintage, geography, size proxy, date.
- Calibration sample drawn from the universe, cross-tab recorded, criterion changes versioned.
- Every exclusion carries a code, version and evidence; pending records counted separately.
- Adjacencies listed separately with their own overlap ratings.
Docket's Triage, Scout and Audit agents take a client's criteria as their questions and return sourced answers with the retained page behind each one.
Sources
- Paul Gompers, Steven N. Kaplan & Vladimir Mukharlyamov, "What Do Private Equity Firms Say They Do?" — NBER Working Paper 21133 (2015), https://www.nber.org/papers/w21133.pdf, accessed 2026-10-28.
- Paul Gompers, Steven N. Kaplan & Vladimir Mukharlyamov, "What do private equity firms say they do?", Journal of Financial Economics 121(3), 449-476 — Elsevier (2016), https://doi.org/10.1016/j.jfineco.2016.06.003, accessed 2026-10-28 (closed access; bibliographic record confirmed via Crossref).
- Robert Cressy, Federico Munari & Alessandro Malipiero, "Playing to their strengths? Evidence that specialization in the private equity industry confers competitive advantage", Journal of Corporate Finance 13(4), 647-669 — Elsevier (2007), https://doi.org/10.1016/j.jcorpfin.2007.04.007, accessed 2026-10-28 (bibliographic record confirmed via Crossref and the University of Birmingham repository; cited for existence only).
- "Understanding NAICS" (2022 Economic Census guidance) — U.S. Census Bureau (2022 vintage), https://www.census.gov/programs-surveys/economic-census/year/2022/guidance/understanding-naics.html, accessed 2026-10-28.
- "Statistics of U.S. Businesses (SUSB)" — U.S. Census Bureau (page revised 2025), https://www.census.gov/programs-surveys/susb.html, accessed 2026-10-28.
- "Buy-and-Build: A Powerful PE Strategy, but Hard to Pull Off", Global Private Equity Report 2019 — Bain & Company (2019), https://www.bain.com/insights/buy-and-build-global-private-equity-report-2019/, accessed 2026-10-28.
External Sources (4)
Published by
Docket Research
Docket provides deal-origination research software and managed research for private equity teams, screening companies against a mandate and showing the evidence behind each finding.
Editorial note
Researched and written by Docket Research with AI-assisted research tools; sources are cited inline and checked before publication. Report an error: https://docket.capital/evidence-standards#corrections.